
- SOLUTIONS
- ZEEING / Operations Solutions / Custom Solutions
SOLUTIONS DETAIL
Explore Our Solutions
See what each solution measures and analyzes — and what action it leads to — alongside its dashboard.
Watt-Up
A data-driven operations solution that monitors charger and connector status in real time
and finds faults first through power waveform analysis
Real-time station monitoring
- ✓Live status of every station and connector on one dashboard
Early fault detection
- ✓Anomaly detection based on power waveforms
- ✓Automatic detection of faults users never report
Lower operating costs
- ✓Fewer unnecessary site visits through remote diagnostics
- ✓Shorter recovery times by knowing the cause before dispatch
Data-driven operations
- ✓Decisions backed by charging and recovery history
Watch-Dog
An end-to-end, data-driven energy management solution that breaks power usage down by floor and room,
finds wasted power, and turns it into savings
Real-time power monitoring
- ✓Live usage by space and load on one dashboard
Lower operating costs
- ✓Less waste through wasted-power detection
- ✓Easy adoption: add-on install at the distribution board, no equipment replacement
Wasted-power detection
- ✓Power patterns analyzed against operating status
- ✓Automatic detection of waste and inefficiency
Data-driven energy operations
- ✓Decisions backed by usage history and before-and-after analysis
Factory Monitoring
A data-driven factory energy management solution that reads each machine's power waveform
to separate running, idling and stopped periods, and finds waste and anomalies
Per-machine power monitoring
- ✓Live usage by machine and line on one dashboard
Operating status diagnosis
- ✓Running vs. idling from power waveforms
- ✓Always-on loads detected during non-operating hours
Predictive maintenance
- ✓Abnormal waveform detection
- ✓Early signs of degradation caught before unplanned downtime
Energy intensity management
- ✓Power per unit of output, for better improvement decisions

ZEEING
A solution that turns the existing power grid of shared parking lots into a smart grid
and builds EV Ready Zones with sequential charging
What is an EV Ready Zone?
A parking area where users can charge an EV with their own portable charger, subject to permission. In Korea this corresponds to the outlets for portable EV chargers defined in Article 6-2 of the Regulations on Housing Construction Standards.
- Korea: new buildings from 2025 must equip 10% of parking spaces
- Spaces usable by both EVs and non-EVs
- No need to move your car
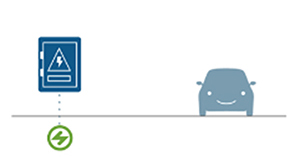
Zone(Capacity in place)
Electrical capacity in place to add EV charging later
- San Jose, CA : 70% (Green Code)
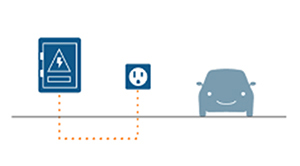
Zone(Outlet installed)
Users can charge with their own charger, subject to permission
- San Jose, CA : 20% (Green Code)
- Chicago, IL : 20% (Zoning&Land Use Code)
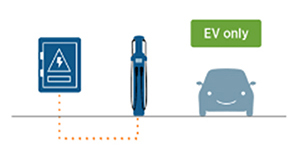
Zone(Charger installed)
Charger installed; reserved for EVs
- San Jose, CA : 10% (Green Code)
Power-sharing smart EV Ready Zone
EV Ready Zones with sequential charging
- Sequential charging: a reservation-based system that charges EVs one after another in booked order
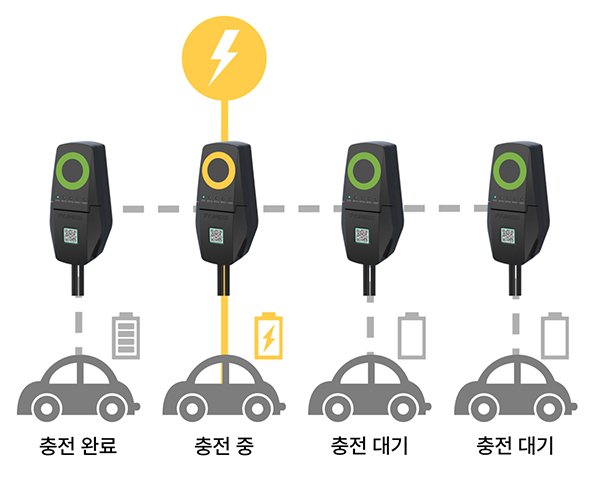
Sequential (reservation) charging
- ✓Simple smart charging, no need to move your car
Higher turnover, new revenue
- ✓Extra revenue by turning spare power into charging capacity
- ✓Off-peak overnight charging through reservations
Safety through power pattern analysis
- ✓Device-to-device control for safe power management and theft prevention
Better user experience
- ✓A service designed around the user

Custom Solutions
Tailored to your environment: smart grid, smart factory, space-by-space power monitoring, smart distribution boards and more.